The world around us is constantly changing. The same is true for groundwater quality, which goes back many years and reflects the use of the land at the surface at that time.
Some well sites extract young groundwater that takes 20-30 years to travel from surface to well, while most well sites have wells that extract water that takes somewhat longer. Some groundwater is hundreds of years old and the groundwater that was formed before the industrialization of both urban and rural areas is free of pollutants.
Land use changes over time
In areas with part agriculture and part forest/nature, where land use has remained unchanged for a long time, some spring sites are located. The catchment areas of other source sites have changed over time from rural to urban, as is the case in Aalborg, for example, as illustrated in the 1961 aerial photograph where Aalborg is partly urban and rural compared to the 1995 aerial photograph where Aalborg is mainly urban.
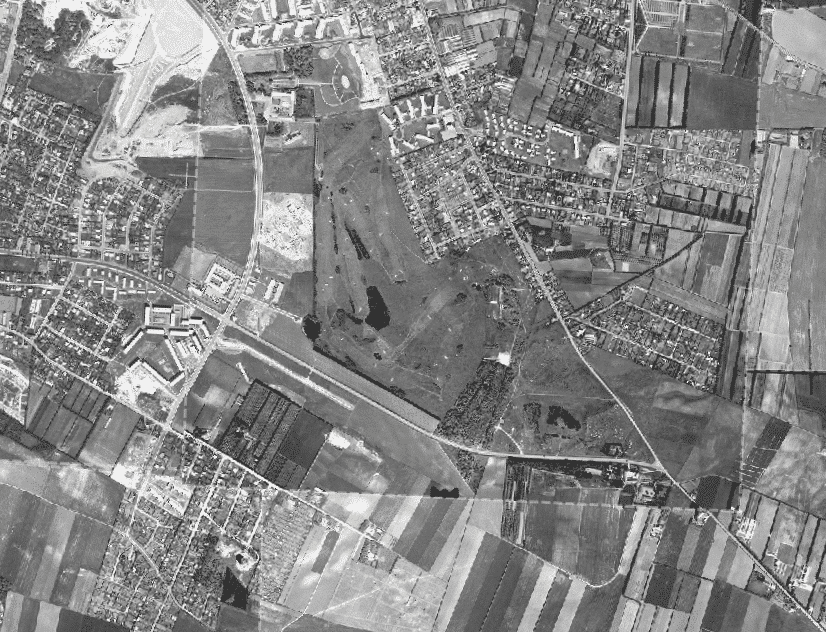
Figure 1: Aerial view of Aalborg, 1961. Source: Flyfoto.dk
At Envidan, we include historical land use change in water quality projections because the impact of pollutants typically changes over time. In water catchments, where urban areas expand beyond rural areas, the chemistry of the water that seeps down changes. The content of problem substances may diminish and disappear and be replaced by others.
A widely used and well-known land use change is when forest replaces agricultural land to protect groundwater from the impact of nitrates and certain pesticide residues. Whatever the change for better or worse for groundwater, you will have to wait a few years before you can either breathe a sigh of relief or, conversely, start having problems.
The water quality forecast is compared with the groundwater age in sub-basins at 10-year time intervals as shown on the aerial photograph of the Sønderbro spring site catchment area.
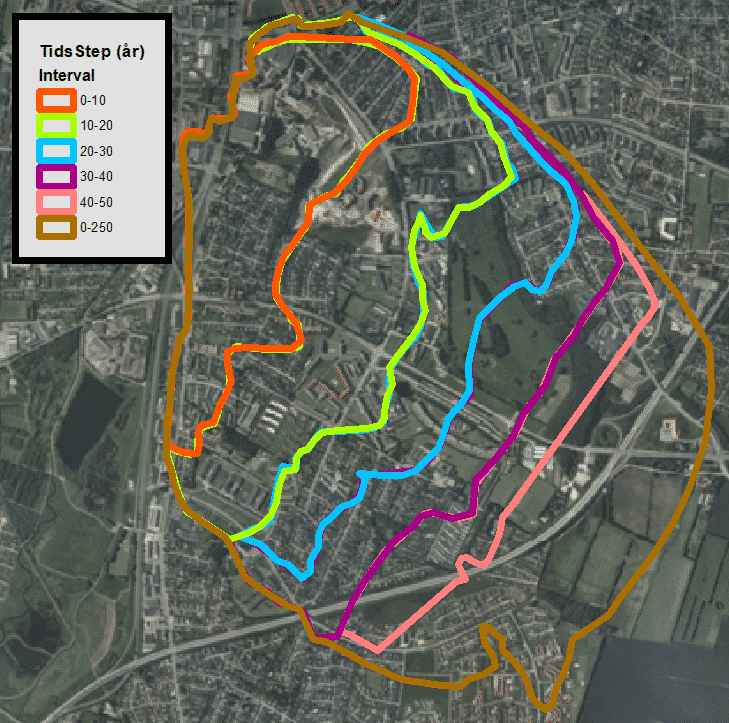
Figure 2: Sønderbro spring site’s catchment area divided by transport times, 1995. Source: COWI web map services.
Once the temporal dependency of the land use is structured, its effect on the selected focal chemical parameters is assessed. The forecast can be made for a source site or individual wells as required.
Land use is assessed from aerial photographs in each sub-basin at, for example, 10-year intervals.
Table 1. Statement of historical area shares in % of N-intensive, extensive and N-, respectively. For groundwater today (0-10 years ago).
Case: Spring site at Sønderbro in Aalborg
An example of how we use historical spatial analysis to assess trends in groundwater quality is the source site at Sønderbro in Aalborg.
Aalborg Forsyning had a well site at Sønderbro 53 until 2003. At that time, extraction was stopped due to excessive levels of the harmful degradation product BAM. However, abstraction has since continued with an output of more than 1 million m3 /year for remedial pumping to keep the groundwater table down in the area.
As the former spring site’s wells are still in operation as remediation wells, Aalborg Forsyning wanted an assessment of the future groundwater quality and an assessment of the possibilities for using the pumped groundwater.
Therefore, Envidan obtained information from a groundwater model for the area, focusing on flow times. The groundwater model is built by WatsonC. Time steps from this model are plotted in Figure 3.
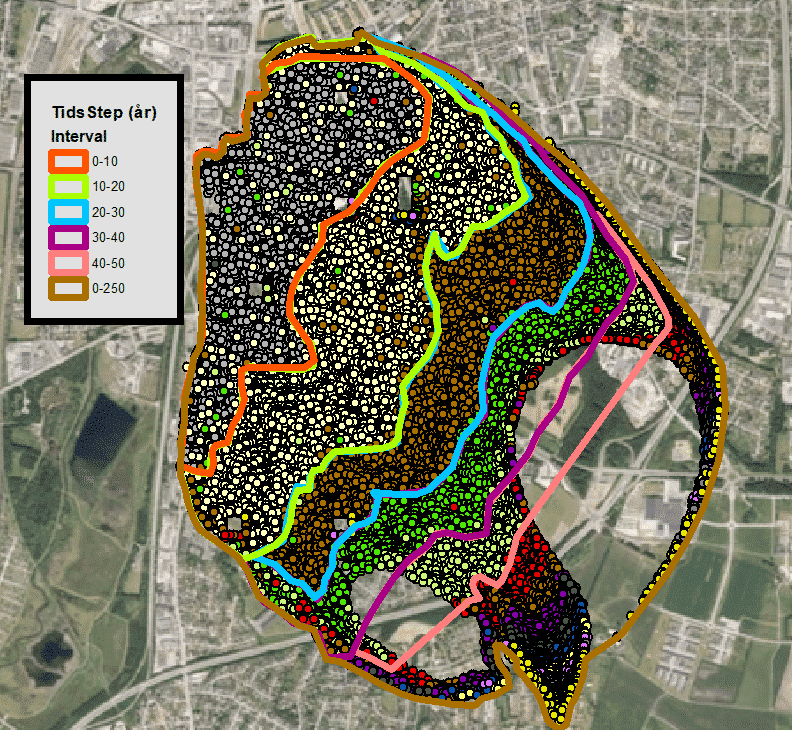
Figure 3: Time steps for residence times in the catchment.
Nitrate impact
Aalborg grows beyond the surrounding fields during the period 1954-2019, which has an impact on the nitrate impact and thus the quality of the water from the source site, as Figures 4 and 5 show.
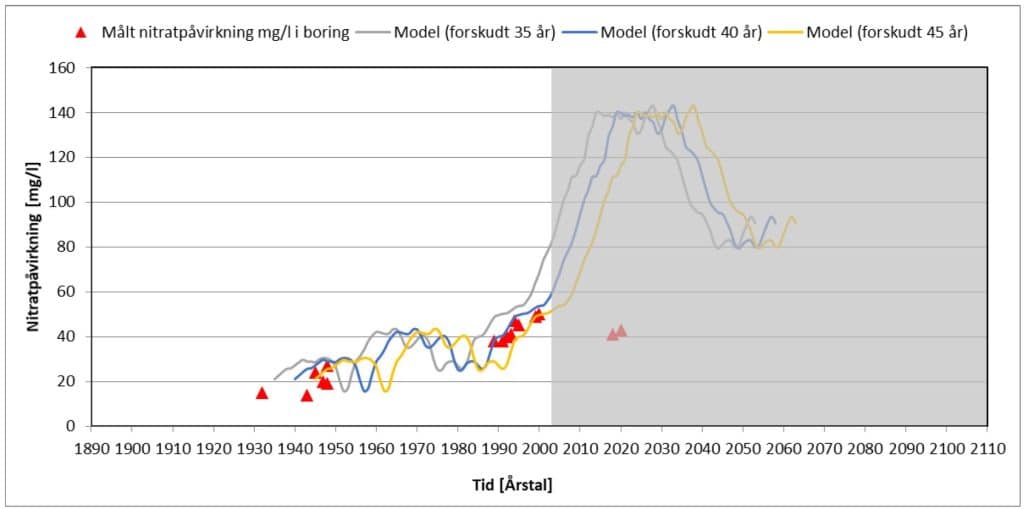
Figure 4. The potential forecast. The part of the curve that is blurred in gray shows how the forecast might have evolved if urban areas had not replaced agriculture in the catchment area.
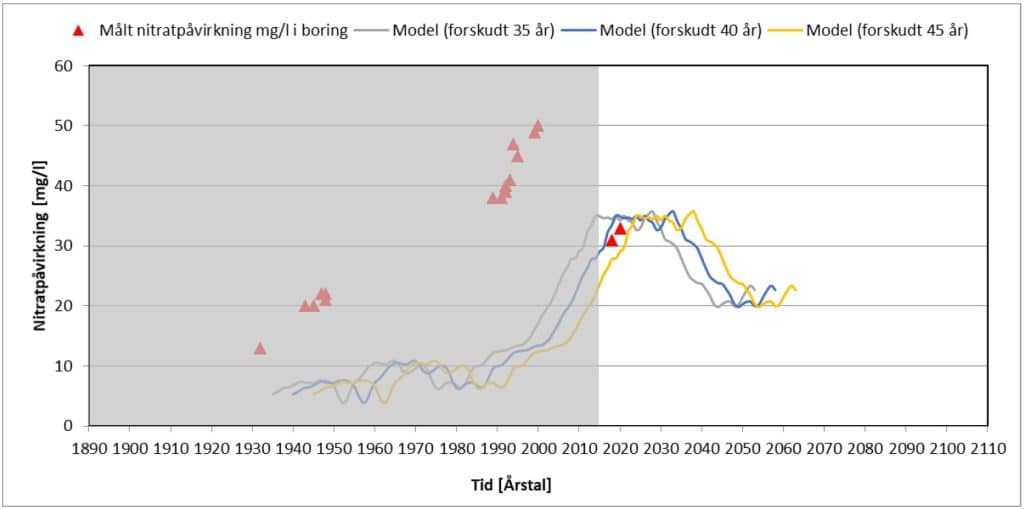
Figure 5. The nitrate forecast adjusted for current land use and that 85% of groundwater is less than 50 years old. The gray blurred part of the figure shows the measurements back in time when there was more agriculture.
As we all know, you can’t change the past, so why does it make sense to look at how the land has been used? It does so because it tells us what we can expect from water quality in the future and what quantities of substances we need to consider at the specific source site. In this way, you can use historical data to improve your water quality forecasts.
Want to know more about our competences in water supply?