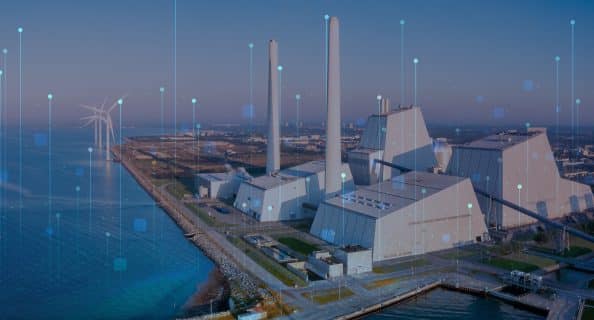
Are you making the most of your data?
Digitalization and data collection are gaining momentum all around us, and the possibilities are endless. However, one thing is certain – data is most valuable if it is aggregated, accessible and usable.
- Does your utility have large amounts of data that are too confusing or time-consuming to understand, process and use?
- Do you already work with data in a focused way, but lack specific data e.g. from Envidan’s own programs?
The utility has several options for using EnviTronic BI
Solution 1 – Dashboards
If your utility needs to analyze and visualize a specific or limited amount of data, Solution 1 allows you to make use of the standard reports and analytics provided by Envidan.
The reports are developed by our data scientists in close collaboration with our software engineers. For this reason, the reports are based on extensive water industry expertise and a high level of data expertise. Therefore, when you work with our experts to assess which reports and analyses you need, it is based on an in-depth knowledge of the water industry combined with extensive professional knowledge of digitalization. The reports and analysis are updated daily, so they are always in line with the latest data.
Solution 2 – Data exports
If your utility already uses data for e.g. internal reporting and wants to supplement with specific data from Envidan, solution 2 allows you to export data from all Envidan products to your desired location.
This way, you get access to exactly the data you need and retain the ability to work with it in your preferred system.
Solution 3 – EnviTronic Pro
With Envtronic Pro, you get all the benefits of EnviTronic combined with the many data utilization options of EnviTronic BI. With EnviTronic Pro you can:
- Collect and compare data across utility types and facilities
- Get standard reports that provide a quick structured overview of data
- Calculate reporting to authorities in just a few clicks
- Share Excel reports with external collaborators
- Visualize data in dashboards
Wherever you are on your digital journey, it’s beneficial to have all your data together, so it’s accessible and usable. This enables you to make the best data-informed decisions and improve your workflows.
Find out where your utility is on the digitalization journey and how you can add the most value to your utility and make even better use of data.
Want to know more about EnviTronic BI and its many applications?
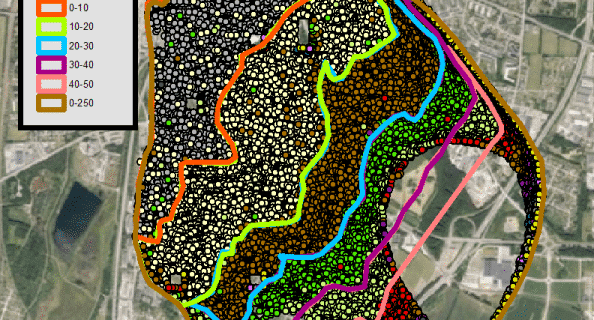
In the second part of the guide, you can read how Envidan dashboards visualize data and give you insight into operations and performance